Our work

Case studies: from data to decisions.

How we frame a question, build the evidence and deliver results people can use.

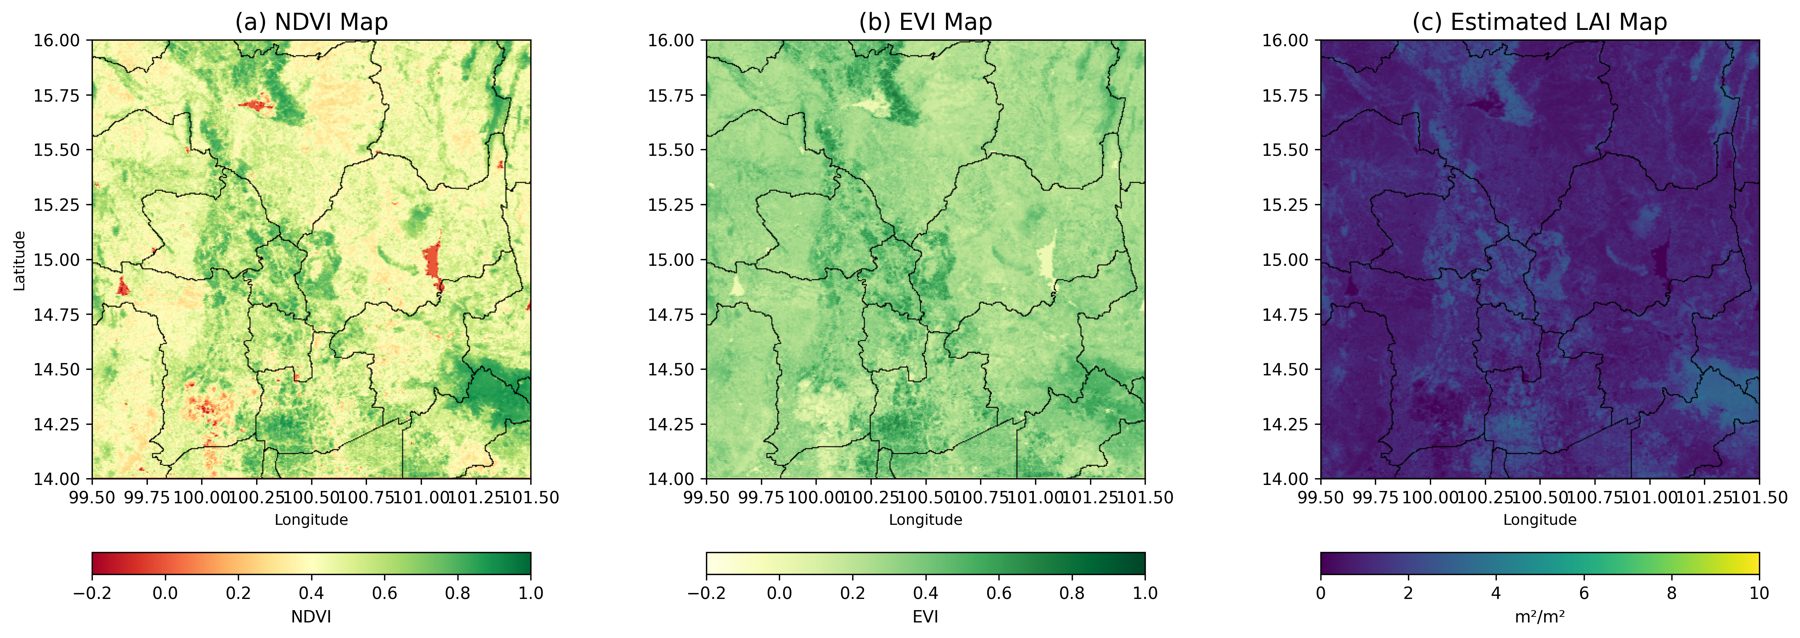
Three maps of Central Thailand showing NDVI, EVI and estimated leaf area index
NDVI, EVI and estimated LAI, Central Thailand · click to enlarge
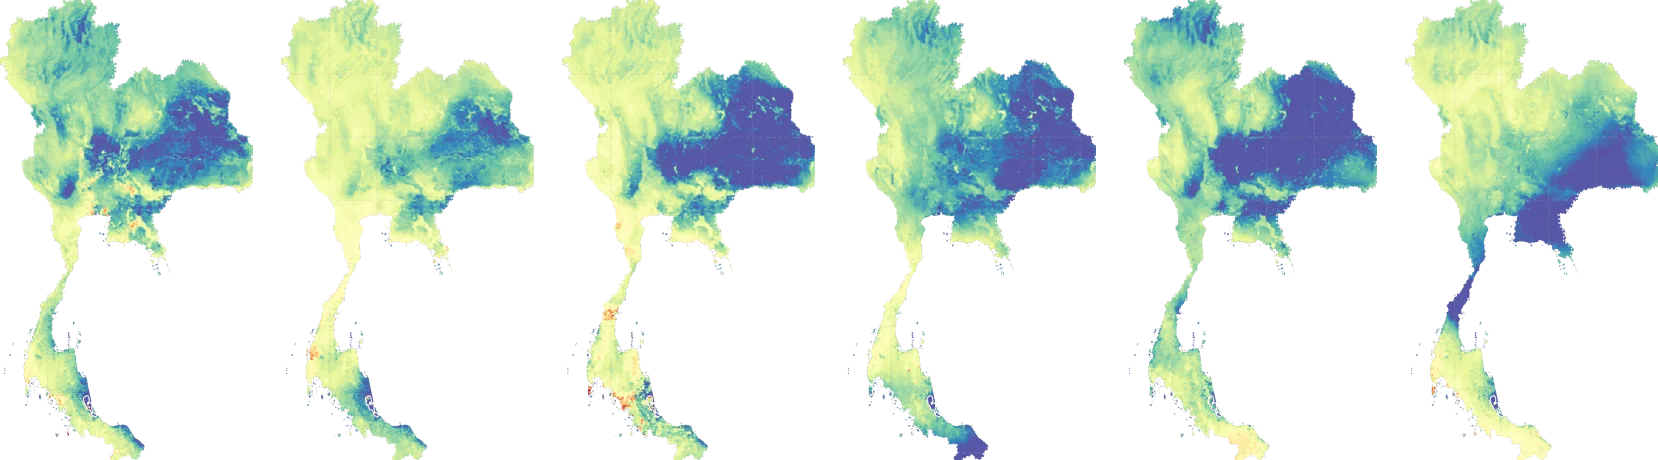
Six daily maps of actual evapotranspiration across Thailand
Daily actual evapotranspiration, 500 m · six consecutive days

Climate analytics · Remote sensing · 2026

Satellite crop-water monitoring, Central Thailand

Challenge

Water managers need to know how much water crops actually use across Central Thailand — at a scale and frequency that field measurements alone cannot provide.

Approach

We developed daily actual and reference evapotranspiration (ETa / ETo) products in Google Earth Engine, combining MODIS land-surface temperature and vegetation indices (NDVI, EVI, LAI) with ERA5 meteorology, plus gap-filling for cloud-affected days.

Outcome

A consistent, gridded record of crop water use and vegetation condition to support irrigation planning and agricultural water management.

DailyETa & ETo time series
3vegetation indices: NDVI · EVI · LAI
GEEcloud-based, repeatable pipeline
MODISERA5Google Earth EnginePython
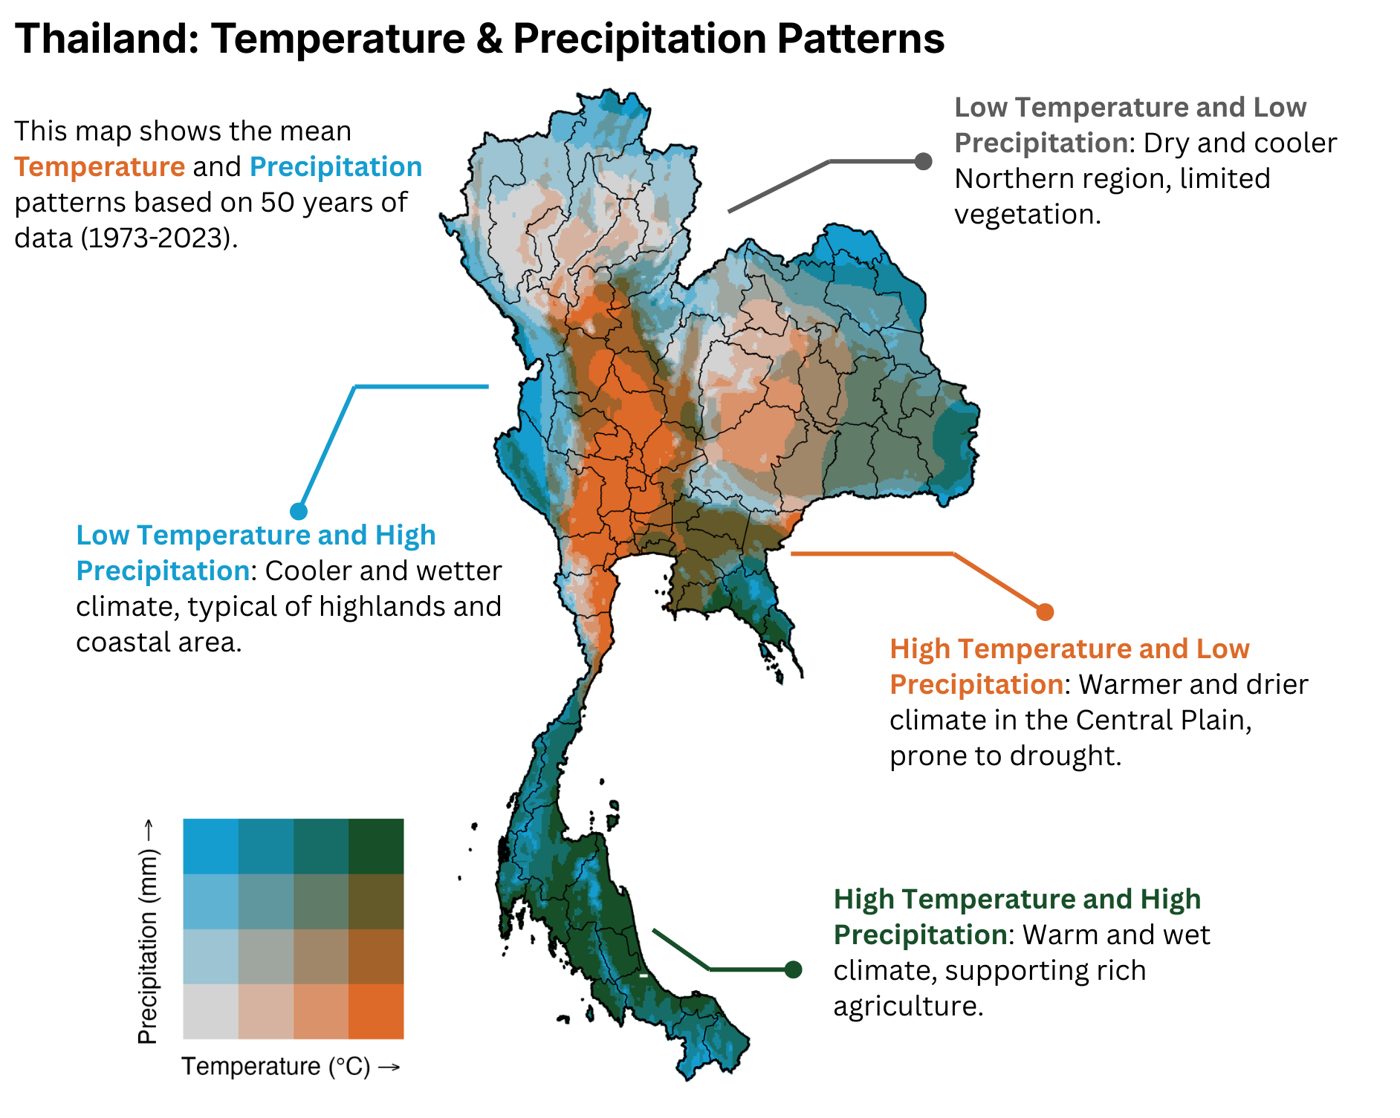
Bivariate map of mean temperature and precipitation across Thailand, 1973–2023
Source: TerraClimate · click for the annotated version

Climate analytics · Data visualisation

Thailand's temperature & precipitation patterns, 1973–2023

Challenge

Climate summaries usually show temperature and rainfall separately, which hides the places where heat and dryness coincide — exactly where drought risk concentrates.

Approach

Using 50 years of TerraClimate data, we built a bivariate map that classifies every location by mean temperature and precipitation at the same time, with province boundaries for planning context.

Outcome

One map that makes Thailand's climate zones readable at a glance: the hot, dry Central Plain prone to drought; the cooler, wetter highlands and coasts; and the warm, wet south that supports rich agriculture.

50 yrsof climate data
16temperature × rainfall classes
77provinces covered
TerraClimateRBivariate mapping

More case studies are on the way.

Have a similar challenge? Let's talk about what the data can show.

Discuss your project